
As a product manager, the value of embedding analytics is clear. It provides your product a key point of differentiation in the market, directly integrates helpful analytics tools so that your users don’t have to go outside of your software for it, and ensures your users derive more value.
But today’s line-of-business users are spoilt for choice when it comes to their data and analytics.
After 20 years of using standalone dashboards and reports (built mostly by IT), a wave of modern embedded analytics solutions have empowered many to build reports and explore their data themselves, and make analytics feel like a core part of the applications they use for work.
However, with this leap in new analytics options brings a new challenge: Users expect more.
The increased accessibility of sophisticated analytics features, from automated monitoring to AI-generated insights, means dashboards and reports on their own no longer cut it in the search for insights. It also means your product’s analytics now require more to stand out from the pack.
While not every product needs to have the latest analytics features to realize success, gaining competitive advantage, keeping future-proof and increasing revenue in this area require being up-to-date. If dashboards are the extent of analytics your product offers today, now is the best time to recognize there are opportunities to expand your capabilities and meet the new baseline.
The constraints of an ad-hoc approach to embedding analytics
For some vendors, analytics in general is never made a priority consideration. The focus may have been on building the initial Minimum Viable Product (MVP) and getting it market-ready, or there’s an intention to add some form of analytical capability later. But typically, it’s left to developers to add in analytical features piecemeal, and to the users to request them.
The problem this ad-hoc approach creates is you may not have an accurate understanding of your product’s current analytical offering, or of what both groups need to make adding a feature worth it - or possible, depending on the state of your data structure and integration capability.
Using the previous example, your product may have had some form of reporting added-on over time, but there’s a big difference between adding on a data export feature for users to pull data and use it in another external analytics tool, and a fully embedded analytics module that sits alongside your core product experience.
Without some formalized process and effort made to guide the introduction of analytics at every phase, your product’s analytical maturity could be at an earlier less sophisticated stage than your team believes it to be, and your users may ultimately not be getting the kind of reliable data and discoverable insights they expected.
Understanding where the analytics in your product stands today
Of course, understanding what a new analytics feature can bring, or when you’re ready to make a move, or even how capable your product’s analytics is today, isn’t always simple.
This is why we made the Embedded Analytics Maturity Curve, a strategic framework and visual roadmap that helps formulate your analytical development, adoption and long-term strategy.
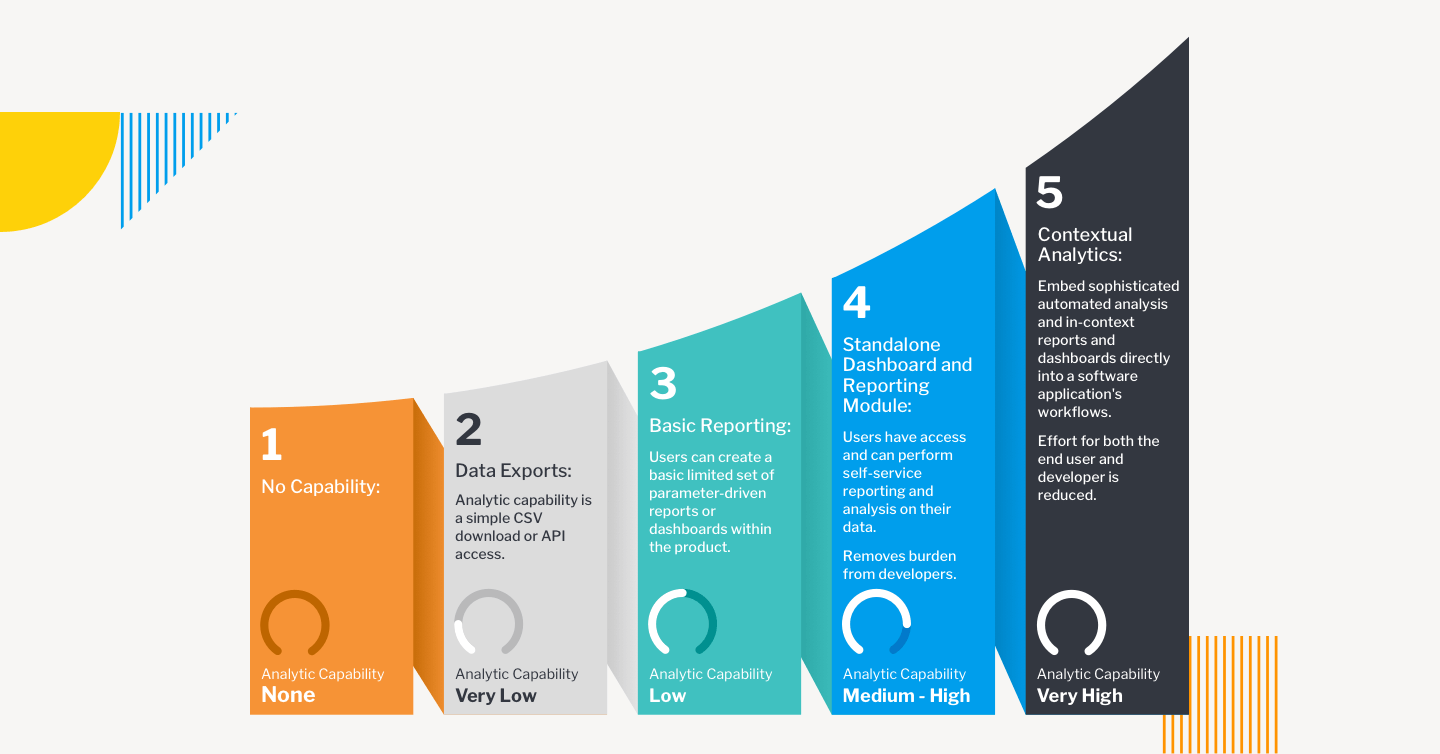
The Curve exists to take product teams through five defined phases of the overall product journey, based on our extensive knowledge gained from helping our customers, to help you understand the requirements to action the most effective and efficient introduction of embedded analytics into your software product possible, whether it is existing software or a new product.
From dashboards to AI insight: 4 things you need know to make the move
The benefits of using a progress model for your product’s analytics pipeline, rather than approaching analytics as an ad-hoc add-on, are numerous, and aim to assist teams to think about and assess key areas that may be overlooked or neglected. Some examples include:
- Identify your data access and structure: Does your product offer users easy access to their data? Is it cleansed and usable to support self-service consumption? Analytics starts with data, but it’s common for product teams busy with other priorities to not have the full picture on what their data actually looks like, how it is structured, or where it’s captured and stored from. Using the Curve helps your team understand it’s not simply a case of offering features, such as data exports or basic reporting, that determine whether your product offers analytical value, but also the readiness and reliability of your data assets to allow your users to derive accurate insights.
- Understand what user insights look like: Are users exporting their data from your product into another to derive value? Can they explore their data and find answers when using your product? The Curve assists in defining the differences in what insights look like in each stage and can help you pin-point what data wrangling is required to meet the requirements for more accurate, sophisticated decision-making and reporting before you can move to your target state.
- Evaluate future analytics scenarios: What typical priorities or roadblocks does the product team need to address before adopting a new analytics feature? What kind of challenges do you face when updating your software with the latest features? The Curve breaks down the many nuances of each stage of maturity for a clearer picture of what to expect, what to address, and whether a move to the next stage is appropriate right now, to minimise rushed transitions.
- Know when you’re ready to update - and why: Your data model is highly performant and you have the internal expertise to embed analytics the right way. Great! But why should you update? The Curve covers the many reasons you should consider moving from one stage to the next - from users struggling to build reports to customers churning to competitors in their search for a better option for analytics consumption - that may not be immediately clear to your team.
Why a strategic approach to your analytical maturity is critical
Many product teams still lack a full picture of the state of their data, users and analytic technologies, but pursuing and implementing meaningful updates to your analytics can only match up to the new, modern expectations the self-service analytics revolution has brought can only be done when you understand and can articulate your current and target capability.
If you need help in getting started, the Embedded Analytics Maturity Curve can provide valuable guidance in what, when and how you can mature your software’s analytical capabilities, and even be a much needed wake-up call for the rest of the organization to get on-board.
Yellowfin is a global analytics and business intelligence (ABI) software vendor with a suite of world-class products powered by automation.
Yellowfin is recognized as an innovator by the world's leading analyst firms. More than 29,000 organizations and over 3 million end-users across 75 countries use Yellowfin every day.

.png?v=9NcA-Rkt22NTrJVL)